Goods distribution planning.
CBT DRP (Distribution Requirements)
CBT DRP is a tool for automatic maintenance (replenishment) of the target inventory level at each managed warehouse.
It is intended for optimum distribution of production for all subjects of delivery, according to the set map of supply chains, with all applied restrictions. Completes volumes of deliveries on transport units, taking into account their restrictions.
When distributing products on a network of business units, you regularly have to answer two questions. First, can we meet all the demand? By “all demand” we really mean all completeness: regular sales (forecast), orders, promotions, insurance reserves, tenders, etc. And secondly, if you still can not meet all the demand – then how to fairly distribute among business units that part that we can still provide?
The trick is that, in the concept of “fair” each company invests its content, its influencing factor, it can be a strict contractual relationship with the network, urgent promotional volume, increasing the expiration date, new packaging format, packaging for the season, high-margin orders etc.
It is also important to analyze this business process also because the difference between the generated demand and the secured part of it will be possible lost sales.
And this is a factor that is important not only to assess the potential of the entire supply chain, but also to assess the profitability of the company. In modern conditions, manually take into account all the influencing factors on the distribution, not to mention their combinations – it is very difficult, you will have to sacrifice something.
Only automated planning can cope with the optimization of the result of combined constraints. Answering the first question will have to determine the optimal level of insurance reserves, the schedule of the shipment warehouse, delivery schedule, delivery schedule, multiplicity, minimum batch, expiration dates, manufacturing options, priorities of business units, etc.
Answering the second question – you need to take into account everything related to the first, plus restrictions on production capacity, quarantine, types of packaging, raw materials, transport logistics, etc.
Capabilities of CBT DRP.
Use as input data both sales forecast and clarifying customer orders (adjustment of sales, promotional activities, retail orders, etc.) .;
Describe supply chain maps of all participants and supply links;
Maintain the target level of inventory in each managed business unit: distributor's warehouse, own warehouse, distribution center, trading house, etc. within the established standards min / opt / max levels of insurance reserves;
Take into account all possible restrictions: class, expiration dates, deficits and surpluses, the level of potential write-offs, insurance reserves, the level of warehouse occupancy, minimum batches, delivery schedules, security of customer orders, etc .;
Perform optimal distribution and replenishment of products in each section of the supply chain, while maximally satisfying the changing demand of customers;
To form picking routes taking into account various restrictions of transport units (product range, batch sizes by volume and weight, multiplicity by units of measurement, transport load factor, planned transport units, etc.) and delivery schedule.
CBT DRP is a tool for automatic maintenance (replenishment) of the target inventory level at each managed warehouse.
System description.
Distribution Requirements Planning (DRP) – product distribution management
DRP Tasks:
Maintenance of optimal stocks in all managed warehouses;
Satisfaction of customer needs;
Formation of target needs for production;
Formation of target needs for the purchase of products.
DRP scheme (scheme of communication with adjacent subsystems).
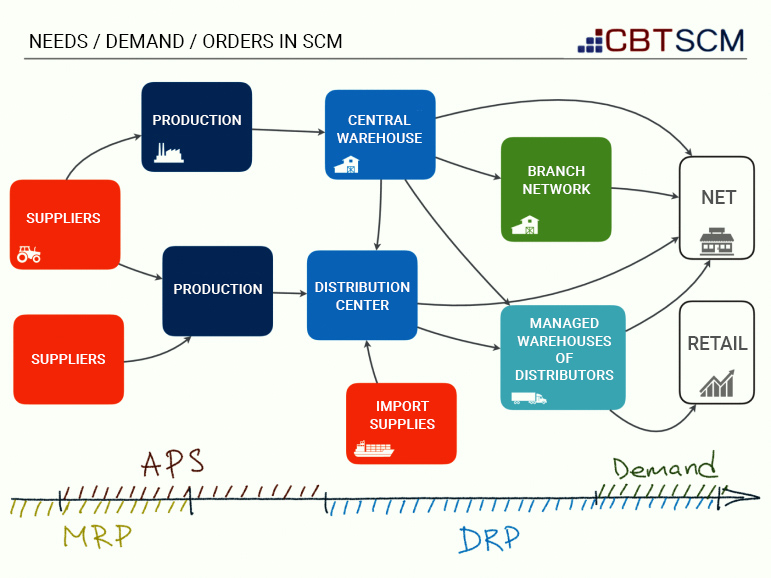
Schematically, any trade and production company can be represented in the form of a diagram.
The “Area of Responsibility of the DRP” includes managed planning entities (shown in the diagram in the form of rectangles), such as:
- Central warehouses (CS);
- Distribution centers (RC);
- Branches, regional warehouses;
- Distributors, warehouses responsible storage.
DRP chain map.
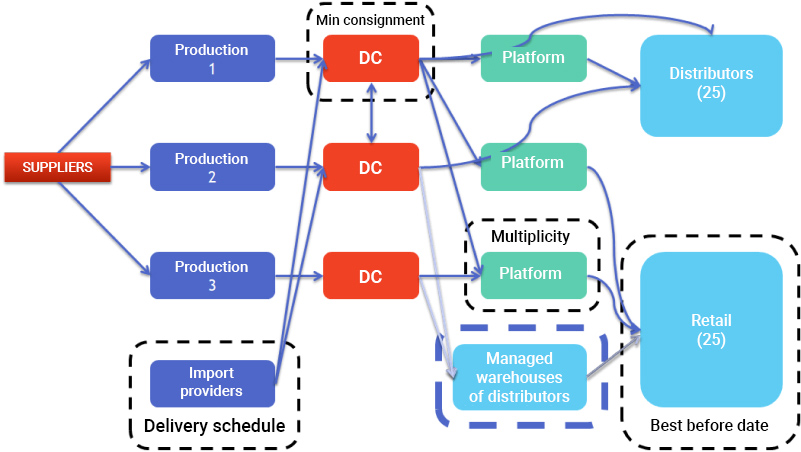
The description of all features of communications, between the managed subjects, occurs in a chain map. Supply chain card installations are so flexible that it allows you to describe the supply chain scheme for any company.
In its minimum form, it is a description of such features of product movement as:
- Minimum batches, multiplicities;
- Procurement / production / relocation / sales schedules;
- Valid rules for expiration dates;
- Required quarantine time;
- Shoulder to purchase.
DRP input management.
At the input, to calculate the next iteration, the DRP-system automatically collects and checks for errors the following data:
actual stocks in managed warehouses (operational accounting);
production plans (from the APS subsystem);
sales forecasts (from the Demand Forecasting subsystem);
stock standards (both in physical terms and in days).
DRP data management wizard.
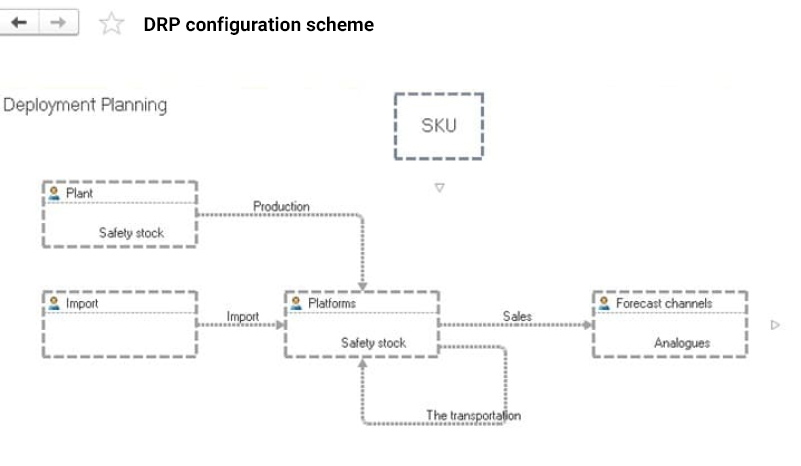
Once, when deploying the system (and then if necessary), the system will need to make a number of data wizards. For convenience of navigation on this data it is possible to use “DRP settings scheme”. They can also be quickly accessed from reports and reference forms.
SKU – planning objects, nomenclature groups, properties, etc.;
Plant, Production -production plan, which limits the secured supply plan;
Import – contractual positions that are not produced;
Platforms – distribution centers, warehouses, plants and other planning entities, the level of stocks of which must be managed;
The transportation – transport logistics and routing;
Forecast channels – final delivery subjects.
Calculation of DRP chains.
The calculation of DRP is performed regularly, after the system regularly collects all the necessary data. The result of simulated calculations for the entire planning horizon can be analyzed in reports and in the list of orders to suppliers. You can make point adjustments, after which the recalculation is performed.
Each iteration of the calculation can be written to a separate scenario (plan). Thus, due to the flexibility in setting up the system, you can perform several calculations for different scenarios, changing the input information, to further compare and select the optimal calculation settings.
Analysis of the performed calculations can be performed using the DRP report (valid for both target and secured plans).
When performing the calculation, the system may take into account a number of supply restrictions, the main:
adhere to the multiplicity, minimum batch and their size;
permissible qualities of the moved products;
schedules of deliveries and work of subjects;
restrictions on expiration dates;
level of insurance stocks (min, opt, max) in planning warehouses;
time for product delivery.
Complete DRP kit.
Completion of orders – grouping of needs, for movement or purchase, in the order. At a complete set restrictions are considered: transport specifications of the order, the schedule of deliveries, the frozen period, distances between subjects, the schedule of work of subjects.
DRP order.
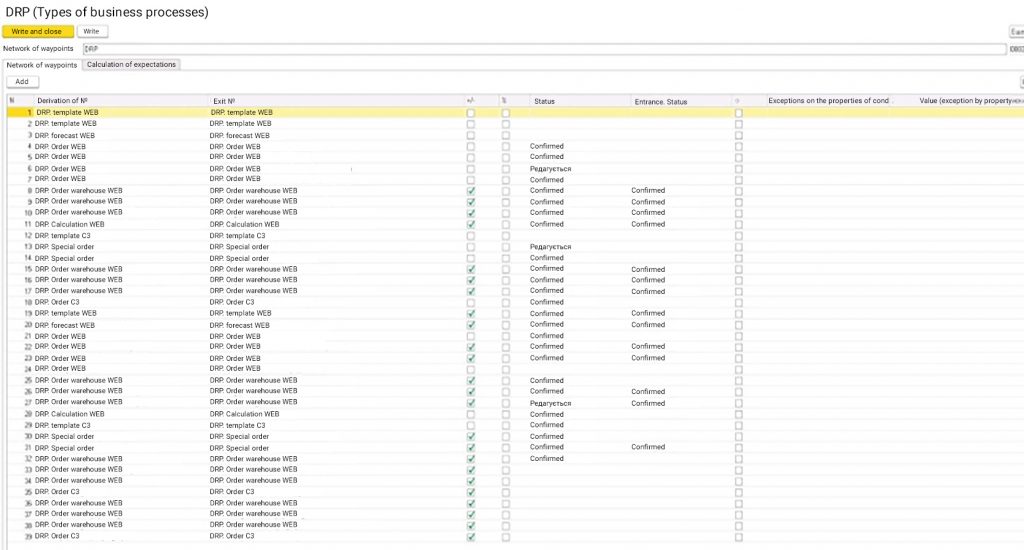
In the system you can configure any business process of working with orders. This includes setting up relationships between different types of orders, such as:
Additionally, the rules for recalculating expectations are set up in the BP.
Expectation – the amount of free actual or planned stock of goods on the date of shipment of the document for each subject of shipment.
Rules for recalculation of expectations – rules that determine which type of settings will affect the formation of free stock on the subjects of shipment.
In turn, each order can be customized – customizing both the appearance, features and business process of coordination.
Mechanisms for making adjustments to on-line documents are supported for collective adjustment of orders.
The order includes all the necessary reports for their detailed analysis. The history of their adjustments is recorded with the possibility of quick analysis.
DRP reports.
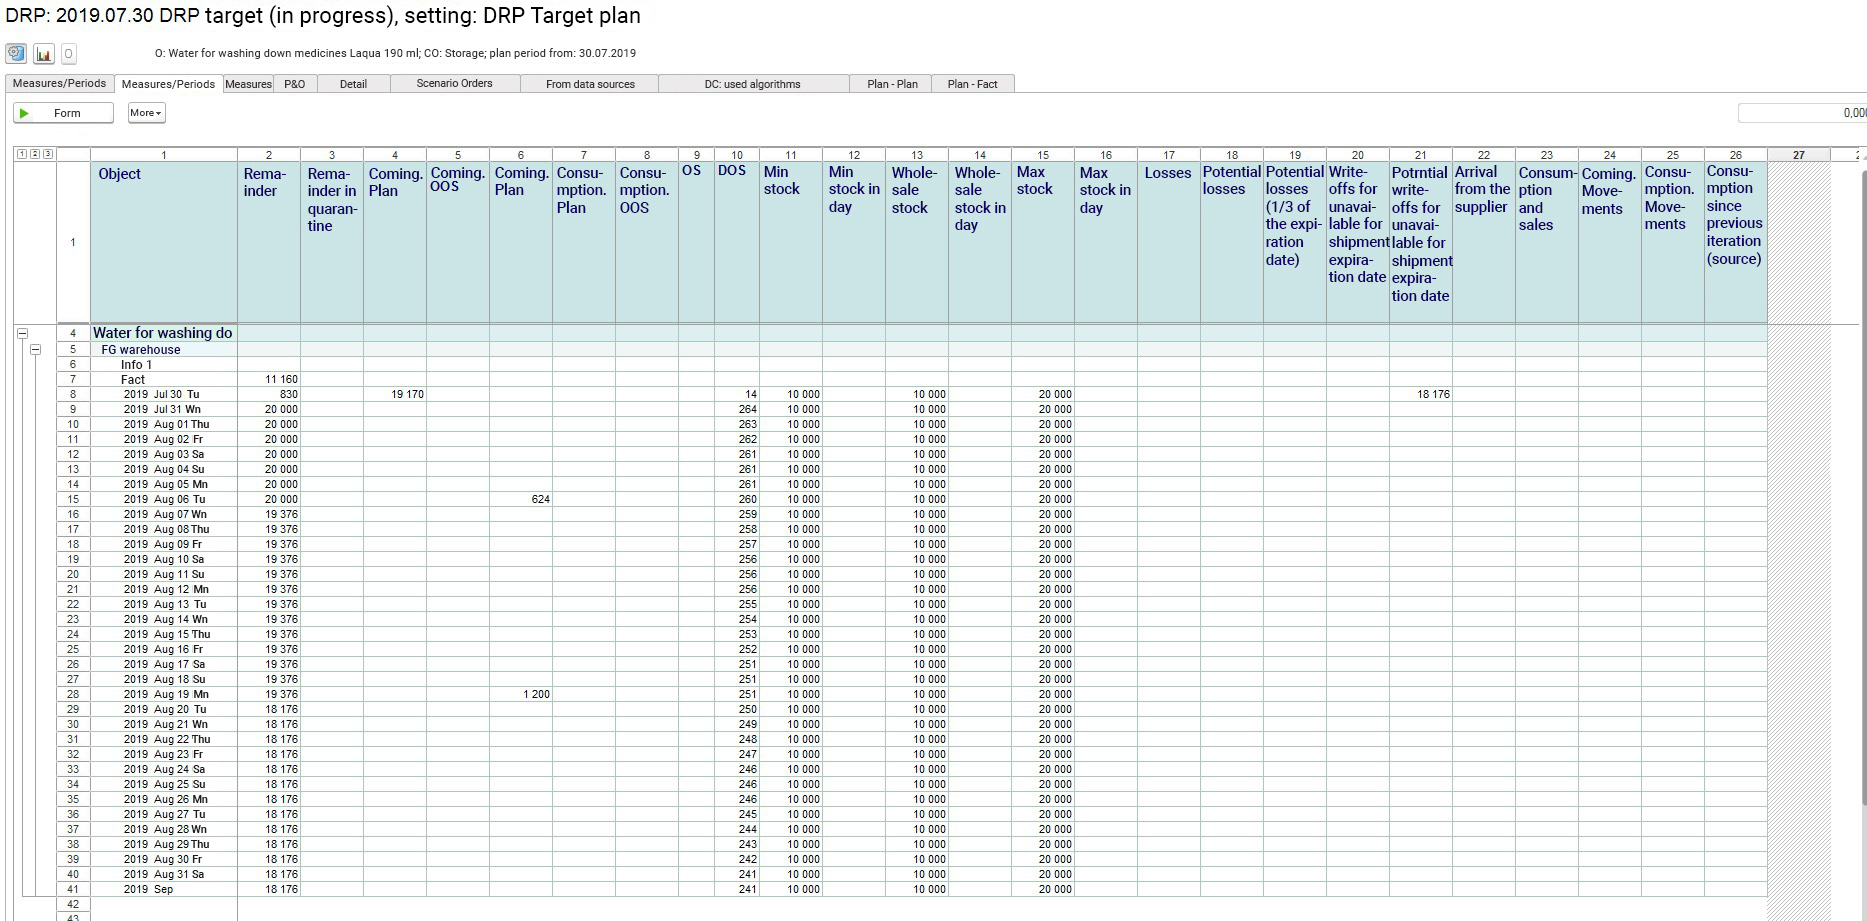
Reports have a flexible and intuitive system of settings and selections. This allows you to customize the report form individually for each user, depending on: the required data sets, sections analyzed, graphical content and visualization of data, which greatly simplifies the work and their initial analysis.
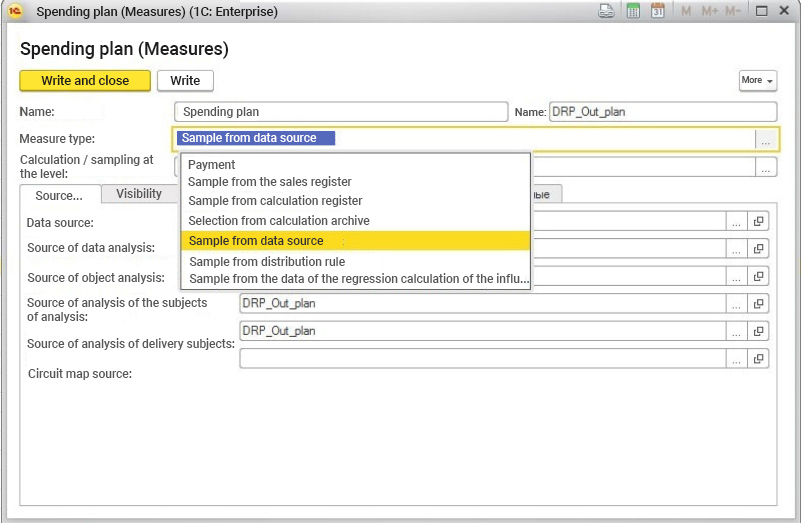
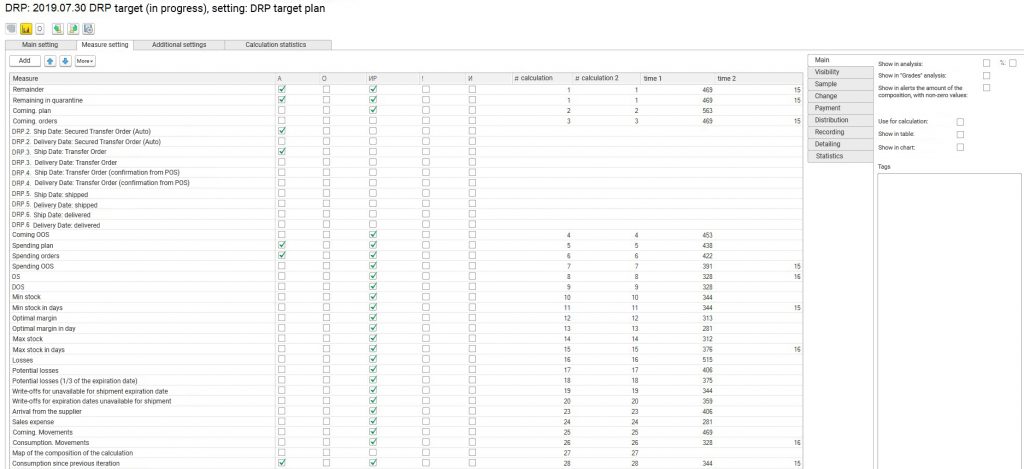
Setting up events (resources).
In this window you can choose which activities and in what order you want to display information in the report windows:
А – analysis window;
Pro – estimation of deviations;
ІР – conclusion of information in the formation of reports “Events / periods”, “Periods / events”;
! – show in Alert;
І – the ability to make changes to a line with a specific measure.
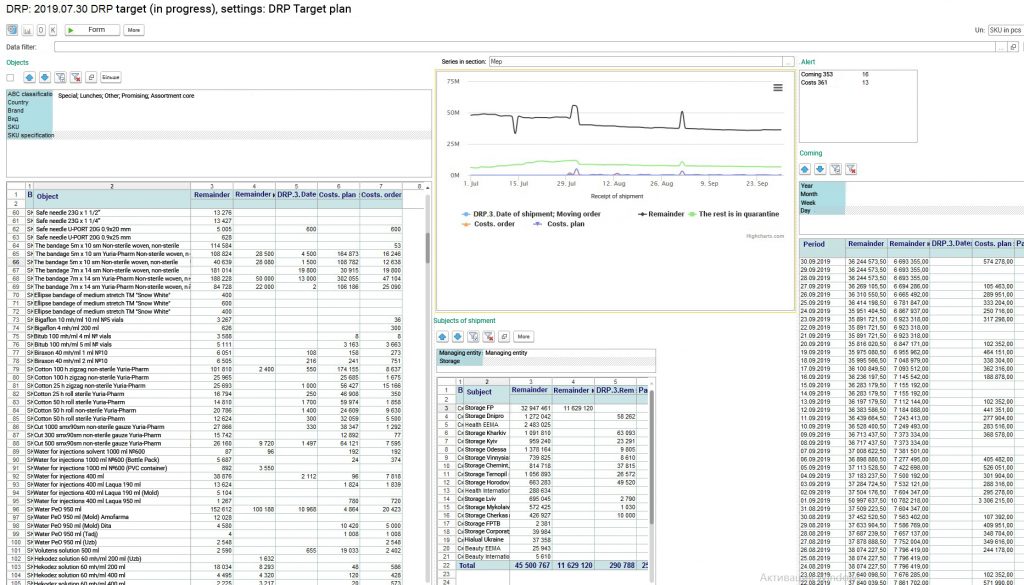
Report “Analysis” – allows you to analyze the grouping of information in terms of objects and subjects, to make selections for specific objects and / or subjects or for those objects / subjects for which the rule of “alarm” worked (Alert).
In addition to analysis, the report allows:
- Bring the frozen period to the delivery and delivery arm and, if necessary, change it with the “LT” command;
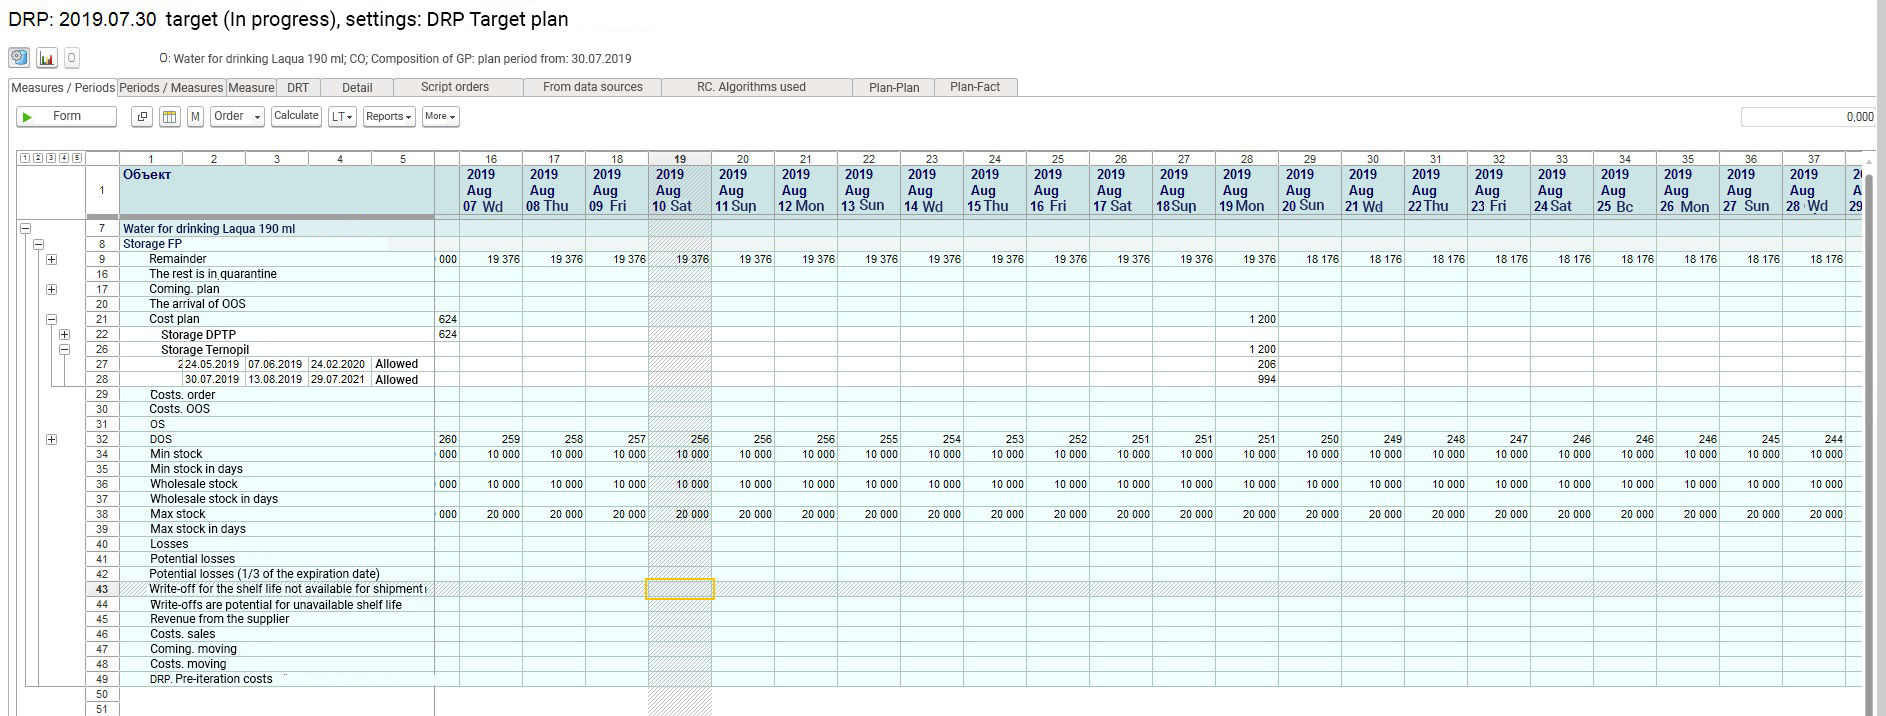
- Interactively make a value in the measures of arrival to the subject with subsequent automatic recalculation of this item. That is – if the user does not fit the amount offered by the system, he changes this amount to his own and immediately sees the result of how stocks will change in future dates. Based on the selected range in the report with the proposed values before arrival, as well as – based on the values entered by the user, the system allows you to create orders directly from the report (Command “Order”), which automatically fill in the fields: dates of shipment and delivery, subjects shipment and delivery (according to information from circuit maps), planning objects and the quantity that falls into the selected range;
- The command “Calculation”: allows you to recalculate the position, for example, after changing the input data (stocks, movements, master data, etc.);
- Reports command: allows you to generate special reports for in-depth analysis.
Distribution
Requirements Advantages.
Automated demand forecasting
Getting the best forecast based on all introductory, in a few steps and in a short period of time.
Convenient analytical reports
With instant visualization of changes in charts and reports when making adjustments.
Quick start
You can quickly start working with the program with minimal settings and restrictions with a gradual transition to high detail, more sophisticated forecasting algorithms and dependencies.
Interactive adjustments
Manual changes to the demand forecast taking into account operational information and analysis of the results of changes.
Flexible demand forecasting
Helps to build the processes of operational sales planning in combination with periodic monthly, quarterly, annual.
A solid foundation
Grow the company without increasing the workload to the departments of planning, marketing and sales. Provides opportunities for the development of forecasting algorithms. Open source.
Customers who trust us.


What goals can you achieve?
Reducing the duration of the operational planning cycle
Increasing the speed of response to changes in the environment and operational information (up to 2-3 hours per day, several iterations of adjustments per day instead of 1-2 times a week earlier and partial daily / weekly rescheduling).
Improving the efficiency of capital use
material, human and other resources through centralized inventory management, sales plans, distribution of products and raw materials
The general decrease in the level of stocks in the system
About 30%.
Faster and deeper analysis
stocks, demand, distribution of raw materials and finished products and their dynamics, with the same or less human resources, the creation of several parallel scenarios for sales forecast and distribution of products.
Strengthening the control of the correctness of the tasks of the automated system
automatic calculations, visual inspection of inventory levels and planning accuracy, analysis of changes in plans for sales, supply, production and distribution of products.
Portfolio.


Reviews.


The SCM scheduling tool reduced the operational scheduling cycle to 1-2 hours per day, allowing several iterations of adjustments per day instead of 2 times a week earlier and only partial daily rescheduling; reduce the staff of planning managers from 8 people to 3 people; conduct in-depth analysis with fewer resources, and receive operational calculations instantly; reduce inventory levels by 30%!
At the same time to increase the level of customer support by 2-3%, which is currently 96-98%; We were able to increase the freshness of products for shipment to customers by 33% and reduce the level of write-offs of expired products in warehouses by 17%; strengthen control over the correctness of the tasks of the automated system through automatic calculations, visual inspection of inventory levels, analysis of changes in plans and incoming data. The implementation of the CBT SCM software solution has contributed to the growth of the business, and the results have exceeded our expectations.
Special algorithms have been developed for Danone Ukraine to take into account the specifics of production, storage and distribution of perishable, as well as shelf life management. Under these conditions, the response time to changes in needs or production plans may not be calculated in days or weeks to manage replenishment.
The SCM scheduling tool reduced the operational scheduling cycle to 1-2 hours per day, allowing several iterations of adjustments per day instead of 2 times a week earlier and only partial daily rescheduling; reduce the staff of planning managers from 8 people to 3 people; conduct in-depth analysis with fewer resources, and receive operational calculations instantly; reduce inventory levels by 30%!
At the same time to increase the level of customer support by 2-3%, which is currently 96-98%; We were able to increase the freshness of products for shipment to customers by 33% and reduce the level of write-offs of expired products in warehouses by 17%; strengthen control over the correctness of the tasks of the automated system through automatic calculations, visual inspection of inventory levels, analysis of changes in plans and incoming data. The implementation of the CBT SCM software solution has contributed to the growth of the business, and the results have exceeded our expectations.


